It is a familiar frustration for any retail leader. One store is sold out of a best-selling item, leading to missed sales and unhappy customers. Meanwhile, another store just a few miles away has a surplus of that exact same product sitting idle, tying up capital and inching closer to a markdown. This common scenario highlights a critical challenge, inventory imbalance. While manual transfers and educated guesses can help, they rarely solve the problem at scale. This is where AI-driven redistribution changes the game, but how do you prove its worth?
Calculating the return on investment for an AI redistribution project goes beyond simple cost versus savings. It requires a clear understanding of specific performance metrics that reveal the true financial and operational impact. This guide provides a framework for measuring the effectiveness of AI in balancing your stock, helping you build a compelling business case and demonstrate tangible value to stakeholders.
Understanding AI inventory redistribution
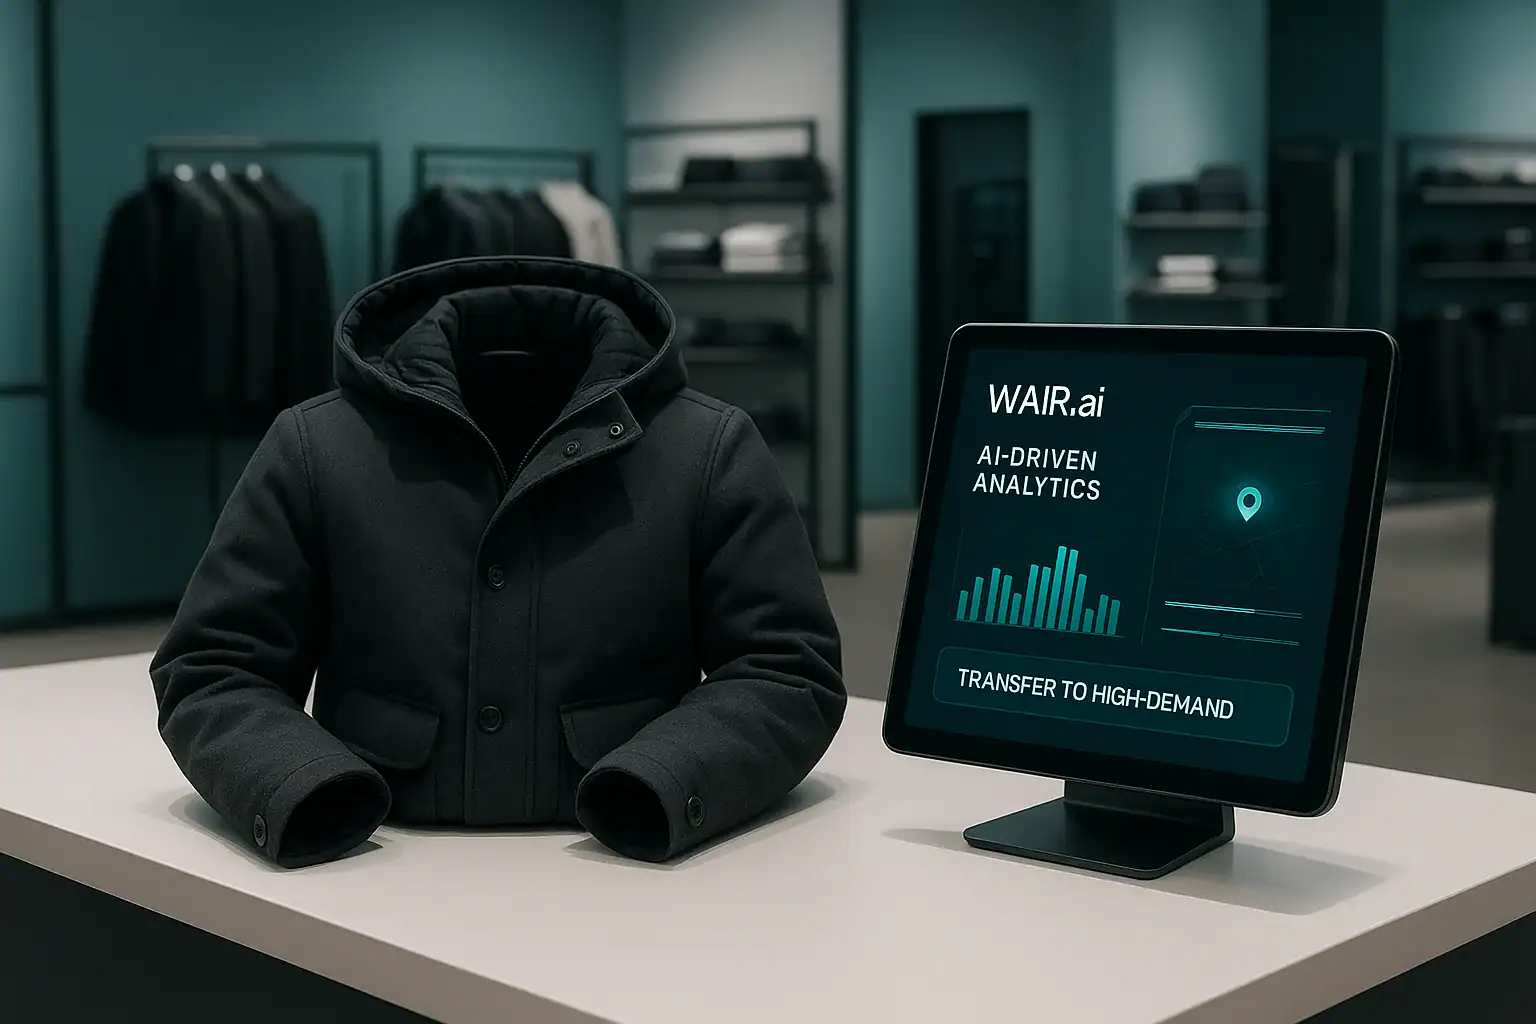
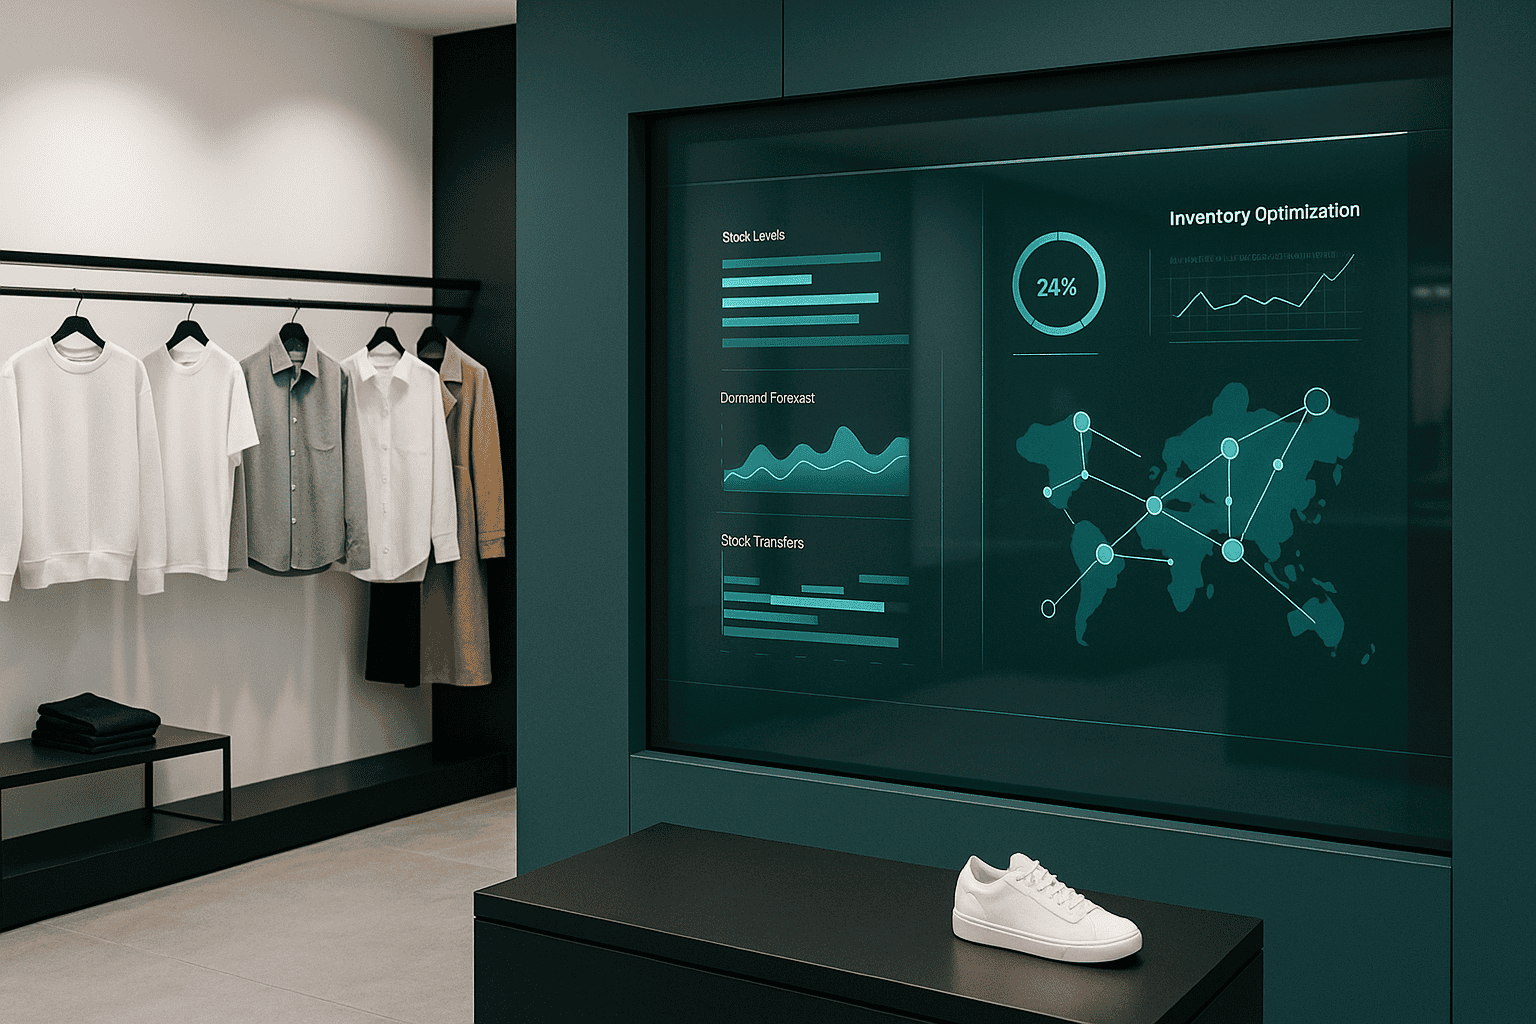
Before you can measure its impact, it is essential to understand what AI inventory redistribution actually does. Unlike general inventory optimization, which focuses on ordering and initial allocation, redistribution is the strategic movement of existing stock between locations to meet localized demand. It is about getting the right product to the right place at the right time, after it is already in your network.
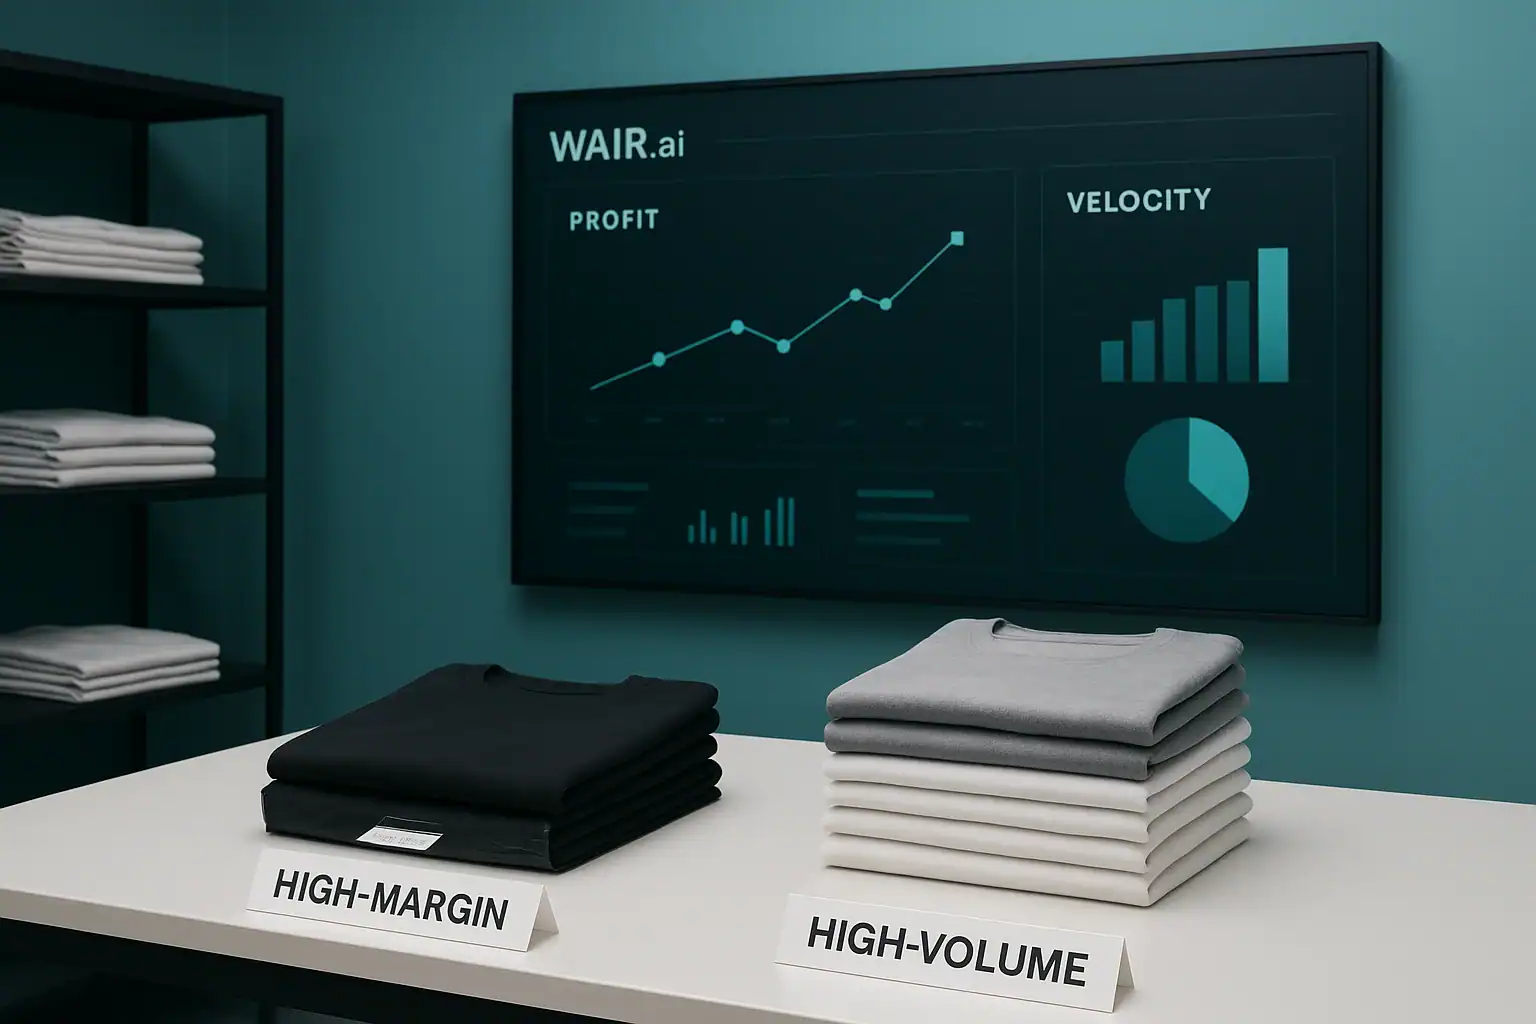
An agentic AI company like WAIR uses sophisticated algorithms to turn this into a precise science. The system analyzes vast datasets including sales velocity, weather patterns, local events, and demographic shifts, to predict where an inventory imbalance is likely to occur. It then proactively recommends or even automates transfers, transforming a reactive, often chaotic process into a predictive and efficient one.
Key metrics for measuring redistribution success
To accurately assess the performance of your AI redistribution efforts, you must track a combination of metrics that cover service levels, inventory efficiency, and profitability. These inventory performance indicators provide a holistic view of the project’s impact.
Service and availability metrics
These indicators measure your ability to meet customer demand at the store level, which is the primary goal of redistribution.
This measures the percentage decrease in instances where a product is unavailable for purchase at a specific location.
This tracks the percentage of customer demand for a particular item that is met successfully without a stockout.
This reflects the probability of not having a stockout, ensuring a higher likelihood that customers find what they want.
Inventory efficiency metrics
These KPIs focus on how well you are managing the flow and value of your inventory across the entire network.
- Network wide inventory reduction:
This calculates the overall decrease in total stock required because inventory is placed more effectively.
- Sell through rate improvement:
This measures the increase in the percentage of inventory sold at full price within a specific timeframe, driven by better placement.
- Reduced at risk inventory:
This tracks the decline in stock that is at risk of becoming obsolete or requiring significant markdowns.
Cost and profitability metrics
Ultimately, the success of any AI project is measured in its financial return. These metrics connect redistribution activities directly to the bottom line.
- Transfer cost optimization:
This measures the reduction in logistics expenses by ensuring transfers are necessary, optimally routed, and consolidated.
This calculates the decrease in revenue lost to markdowns, as proactive transfers move slow selling items to locations with higher demand.
This reflects the overall increase in profitability resulting from higher full price sales and fewer markdowns.
A step by step guide to calculating ROI
Once you have established your key metrics and have a baseline from before implementing AI, you can calculate the project’s return on investment. The fundamental ROI formula is straightforward, but applying it correctly to an AI redistribution project requires careful consideration of both costs and benefits. For a deeper look at the financial models involved, explore how to analyze Retail AI performance.
Step 1: Quantify all project costs
First, you need a complete picture of the total investment. This includes more than just the software subscription. Be sure to account for all associated expenses.
This covers software licensing, implementation fees, and any necessary hardware upgrades.
This includes the expenses related to connecting the AI system with your existing ERP, POS, and WMS platforms.
- Training and change management:
Factor in the cost of training your merchandising, planning, and store teams to use the new system effectively.
- Ongoing operational costs:
This includes subscription fees, maintenance, and any internal personnel dedicated to managing the AI tools.
Step 2: Quantify all financial benefits
Next, translate the improvements in your KPIs into tangible dollar figures. This is where you connect operational gains to financial outcomes.
- Increased revenue from reduced stockouts:
Calculate the sales recaptured by having products available in stores where they previously would have been sold out.
- Cost savings from markdown avoidance:
Quantify the money saved by selling more items at full price instead of marking them down.
Calculate the savings from carrying less overall inventory across your network.
- Lower logistics expenses:
Measure the reduction in shipping costs from more efficient and consolidated transfer orders.
Step 3: Apply the ROI formula
With all costs and benefits identified, you can now calculate the ROI. The formula is:
ROI (%) = (Net Profit / Total Investment Cost) x 100
For example, if your net profit from AI redistribution (total benefits minus ongoing costs) in the first year is $500,000 and your total initial investment was $200,000, the ROI is 250%. This simple yet powerful calculation demonstrates the financial viability of the project. A strong ROI of AI-based demand planning is often a key driver of these benefits.
Overcoming common measurement challenges
Measuring the impact of AI is not always straightforward. It is important to anticipate and address common challenges to ensure your ROI calculations are accurate and credible.
One of the biggest hurdles is isolating the “AI effect.” Business conditions are always changing. A new marketing campaign or a shift in consumer trends could also impact sales. To attribute gains correctly, consider running a pilot program with a control group of stores that do not use the AI system. This allows you to compare performance and more accurately measure the quantifiable business impact of your AI tool.
Data quality is another critical factor. An AI system is only as good as the data it receives. Before launching, ensure your inventory, sales, and product data are clean, accurate, and standardized across all systems. Inaccurate baseline data will lead to misleading performance metrics and an unreliable ROI calculation.
From data points to dollar signs your AI redistribution business case
Moving from guessing to knowing is the core promise of artificial intelligence in retail. By focusing on the right performance metrics and applying a disciplined ROI framework, you can translate the operational benefits of AI powered redistribution into a clear financial narrative. This data driven approach not only justifies the initial investment but also builds confidence among stakeholders that AI is a critical engine for growth, efficiency, and profitability.
With a clear understanding of its financial impact, you can confidently champion AI as a solution to inventory imbalance, transforming a persistent retail headache into a significant competitive advantage. An effective tool like the AI Redistributor can be the first step in this journey.
Frequently asked questions
Q: What is AI inventory redistribution?
A: AI inventory redistribution is the use of artificial intelligence to strategically move products between different retail locations (like stores or distribution centers) to better match local customer demand, reduce stockouts in one area, and prevent overstock in another.
Q: What are the most important metrics for an AI redistribution project?
A: The most critical metrics fall into three categories: service levels (stockout rate, fill rate), inventory efficiency (sell through rate, network inventory levels), and profitability (markdown reduction, gross margin uplift).
Q: How is ROI for an AI project different from other IT projects?
A: The ROI for an AI project is often more dynamic. While traditional IT projects may focus on one time cost savings, AI projects deliver continuous value through ongoing learning and optimization, leading to compounding benefits in areas like sales lift and margin improvement.
Q: Where do I start with measuring the impact of AI redistribution?
A: Start by establishing a clear baseline. Collect at least six to twelve months of historical data for your key performance indicators before implementing the AI system. This baseline will be the benchmark against which you measure all future improvements.